
Deep learning for NeuroImaging in Python.
Note
Go to the end to download the full example code.
Spherical augmentations
Credit: A Grigis & C Ambroise
A simple example on how to use augmentations in the spherical domain.
import numpy as np
import matplotlib.pyplot as plt
from surfify.utils import icosahedron, neighbors, min_depth_to_get_n_neighbors
from surfify.plotting import plot_trisurf
from surfify.augmentation import (
    SurfCutOut, SurfNoise, SurfBlur, SurfRotation, HemiMixUp, GroupMixUp,
    Transformer, interval)

vertices, triangles = icosahedron(order=3)
neighs = neighbors(vertices, triangles, direct_neighbor=True)
max_depth = min_depth_to_get_n_neighbors(np.ceil(len(vertices) / 4))


def display(vertices, triangles, texture, aug, add_axis=False, alpha=1, *args,
            **kwargs):
    """ Display augmented data.
    """
    fig, axs = plt.subplots(
        2, 2, subplot_kw={"projection": "3d", "aspect": "auto"},
        figsize=(10, 10))
    axs = axs.flatten()
    plot_trisurf(vertices, triangles, texture, ax=axs[0], fig=fig,
                 alpha=alpha, colorbar=False, edgecolors="white",
                 linewidths=0.2)
    if add_axis:
        axs[0].plot([0, 0], [0, 0], [-1, 1], c="red")
        axs[0].plot([0, 0], [-1, 1], [0, 0], c="blue")
        axs[0].plot([-1, 1], [0, 0], [0, 0], c="green")
    for idx in range(1, len(axs)):
        _texture = aug(texture, *args, **kwargs)
        if add_axis:
            axs[idx].plot([0, 0], [0, 0], [-1, 1], c="red")
            axs[idx].plot([0, 0], [-1, 1], [0, 0], c="blue")
            axs[idx].plot([-1, 1], [0, 0], [0, 0], c="green")
        plot_trisurf(vertices, triangles, _texture, ax=axs[idx], fig=fig,
                     alpha=alpha, colorbar=False, edgecolors="white",
                     linewidths=0.2)
    fig.tight_layout()
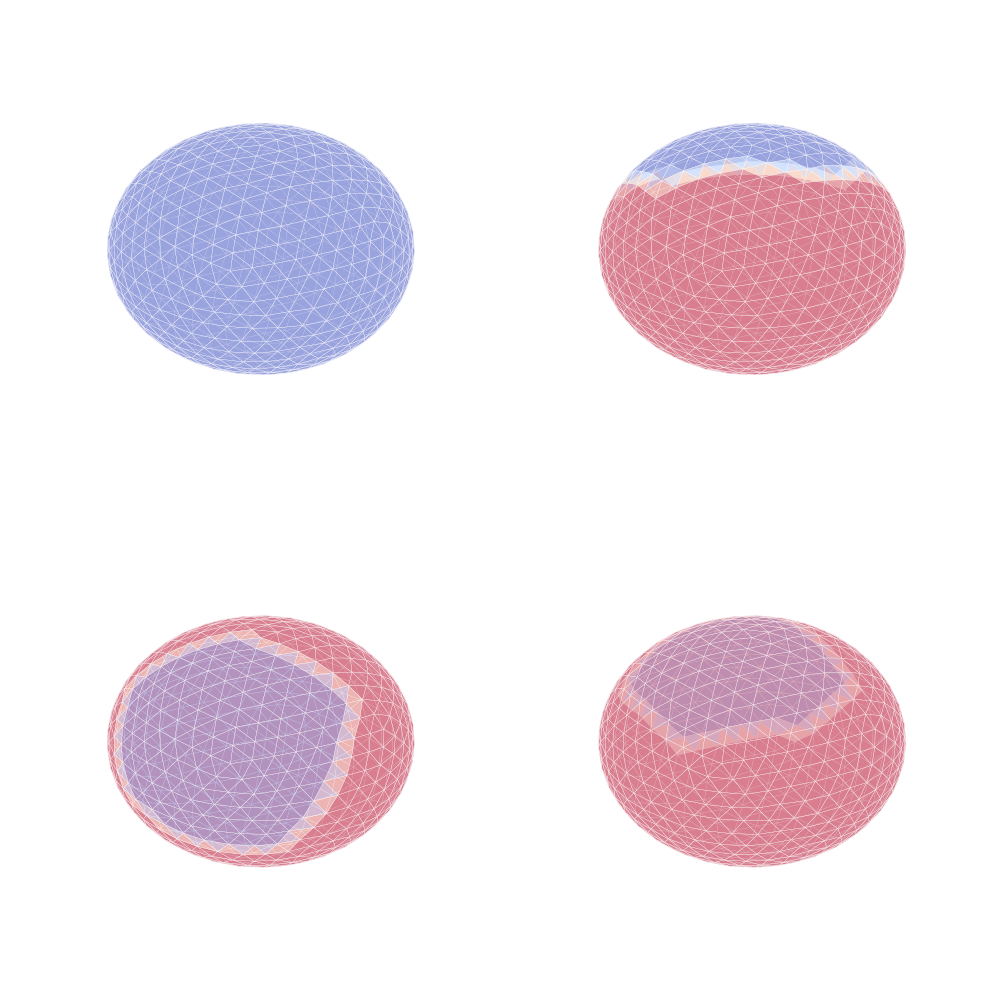
SurfCutOut
texture = np.array([1, ] * len(vertices))
aug = SurfCutOut(vertices=vertices, triangles=triangles, neighs=neighs,
                 patch_size=interval((2, max_depth), int),
                 n_patches=interval((1, 3), int),
                 sigma=1)
display(vertices, triangles, texture, aug, alpha=0.3)
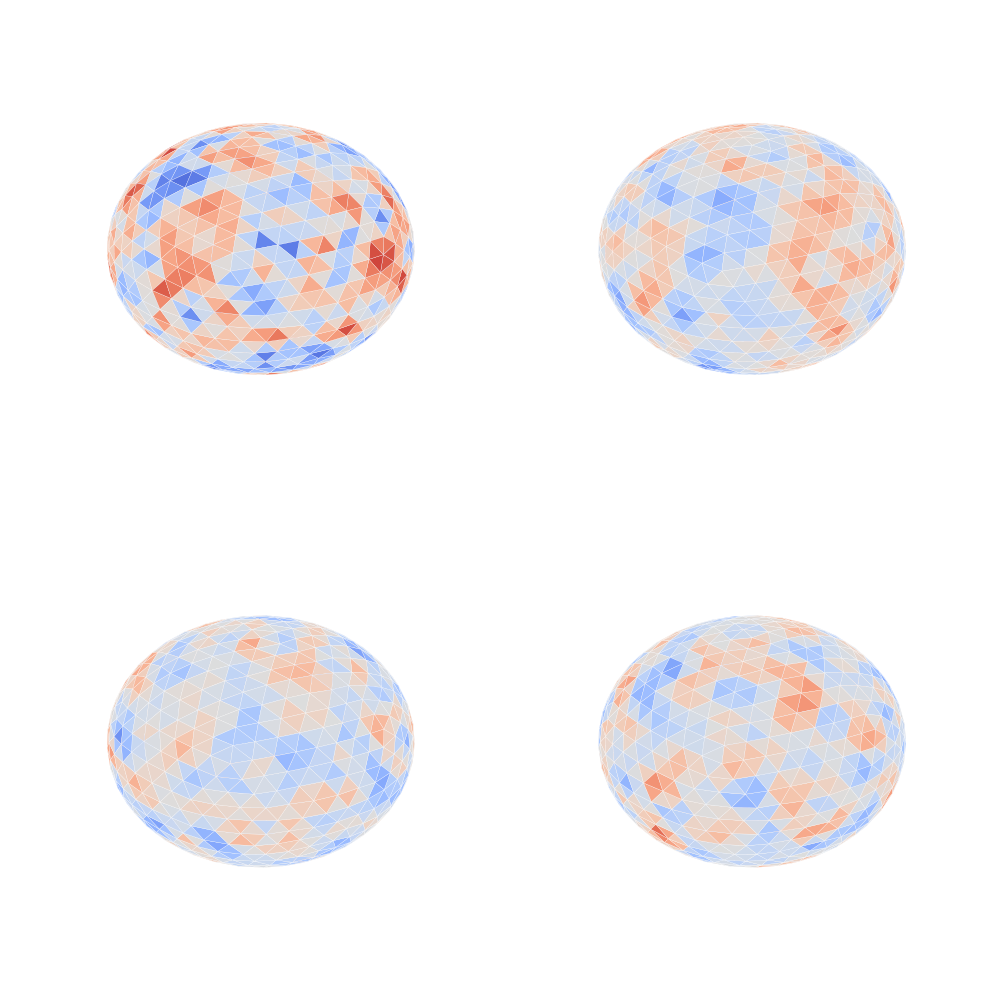
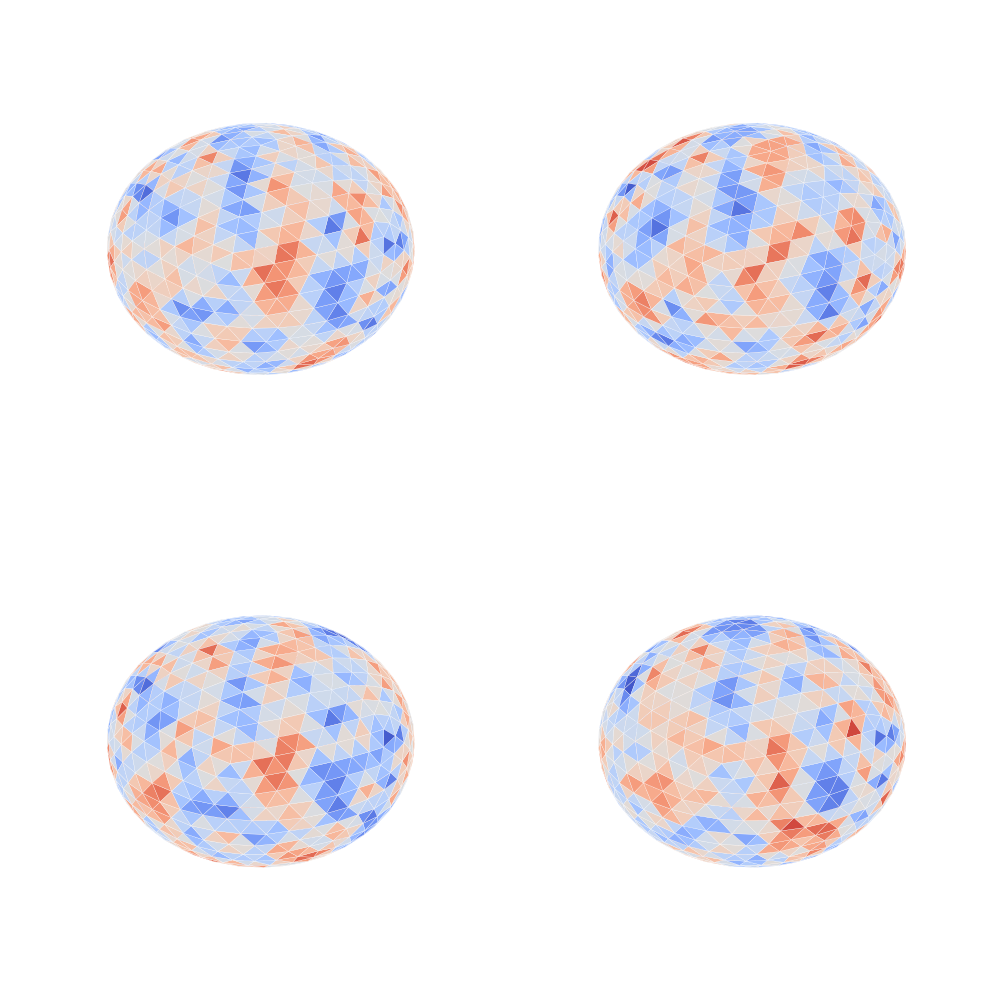
SurfNoise
texture = np.random.uniform(0, 3, len(vertices))
aug = SurfNoise(sigma=interval((1, 3), float))
display(vertices, triangles, texture, aug)
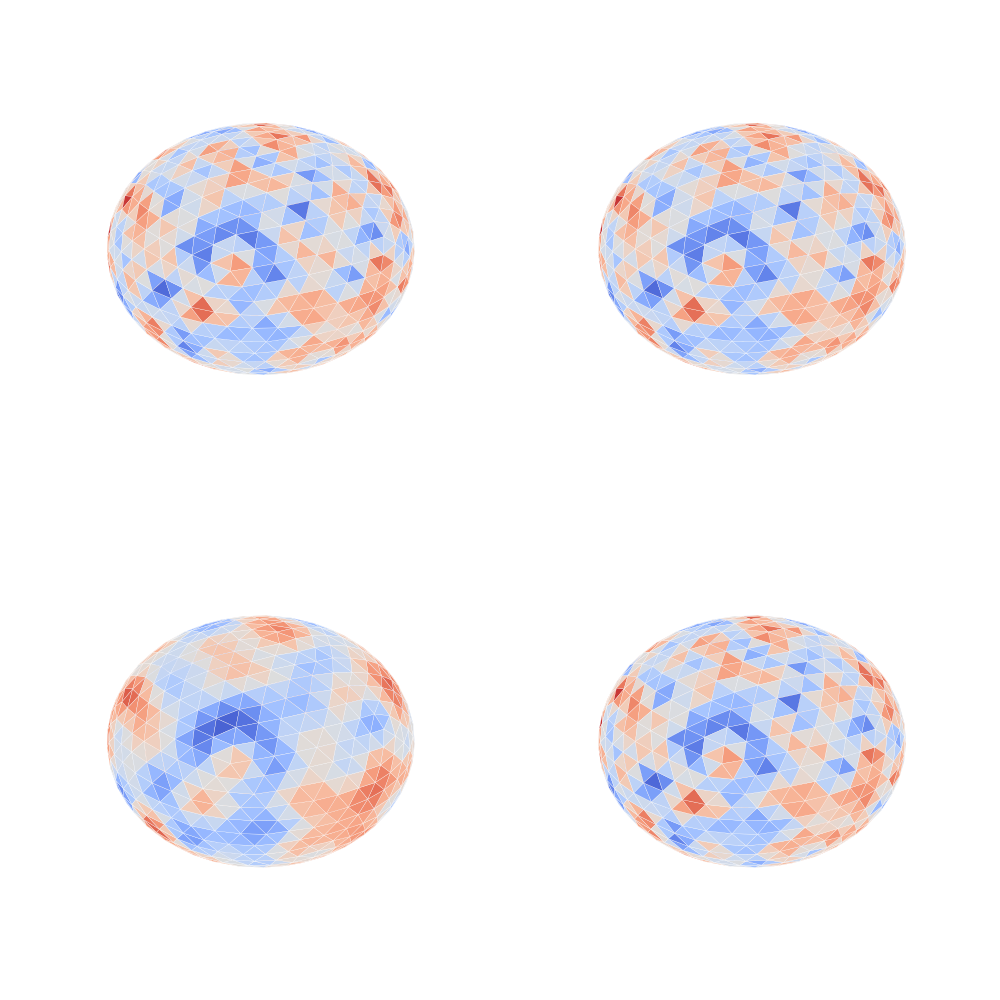
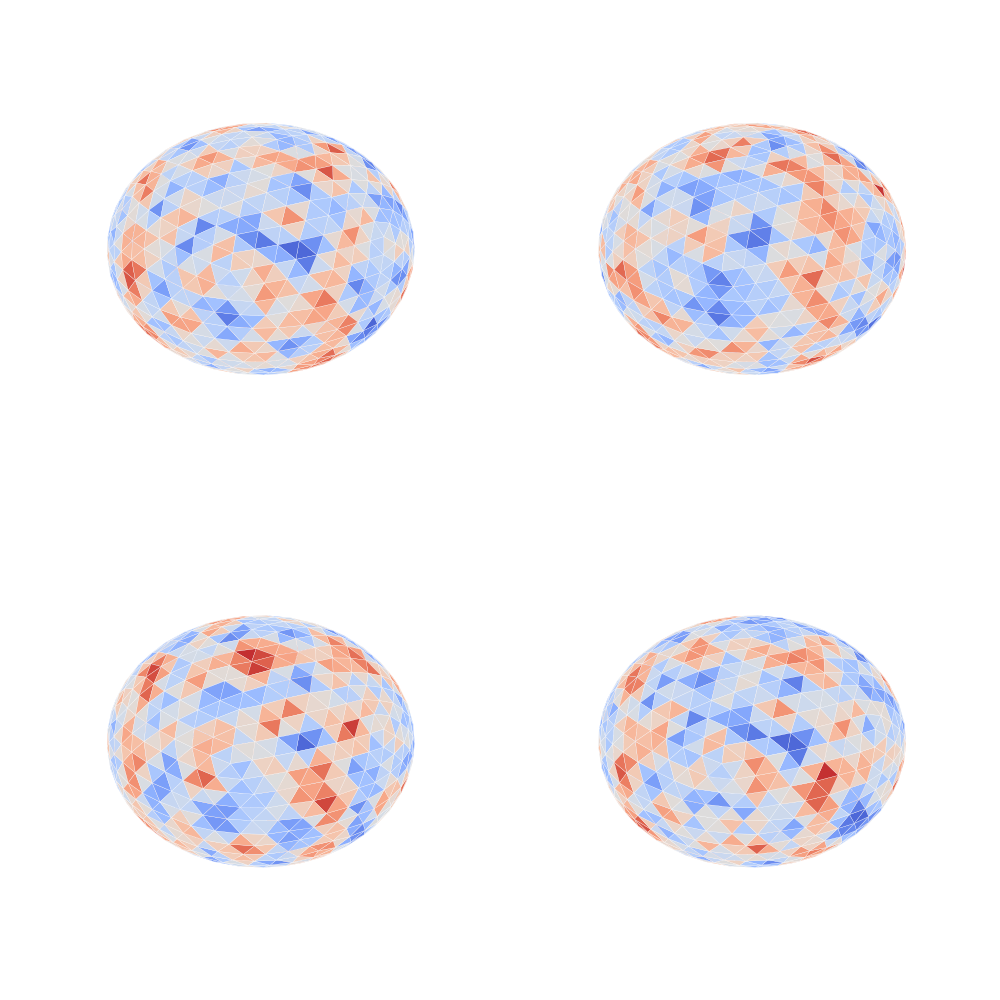
SurfBlur
texture = np.random.uniform(0, 2, len(vertices))
aug = SurfBlur(vertices=vertices, triangles=triangles,
               sigma=interval((0.1, 1), float))
display(vertices, triangles, texture, aug)
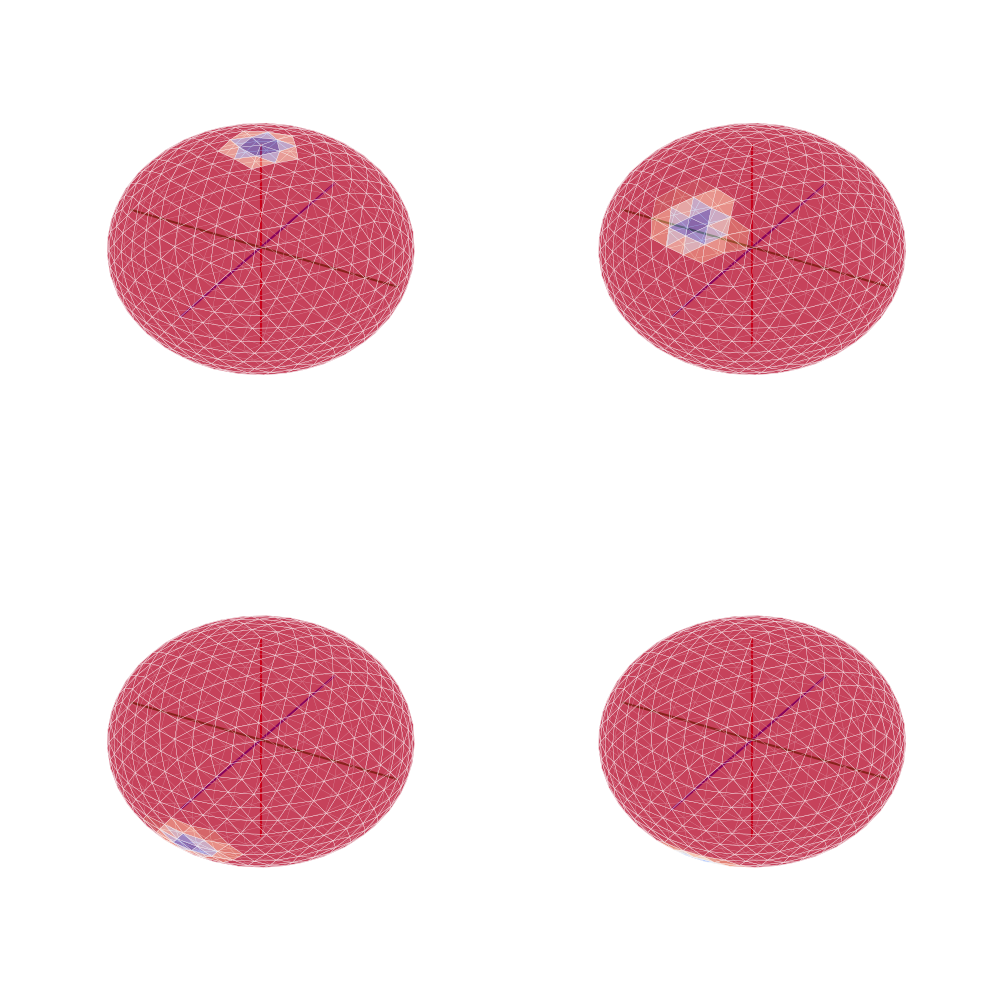
SurfRotation
texture = np.array([1, ] * len(vertices))
aug = SurfRotation(vertices, triangles, phi=interval((5, 180), float), theta=0,
                   psi=0)
texture[neighs[0]] = 0
display(vertices, triangles, texture, aug, add_axis=True, alpha=0.5)
HemiMixUp
texture = np.random.uniform(0, 3, len(vertices))
controlateral_texture = np.random.uniform(0, 3, len(vertices))
aug = HemiMixUp(prob=interval((0.2, 0.5), float), n_vertices=len(vertices))
display(vertices, triangles, texture, aug,
        controlateral_data=controlateral_texture)
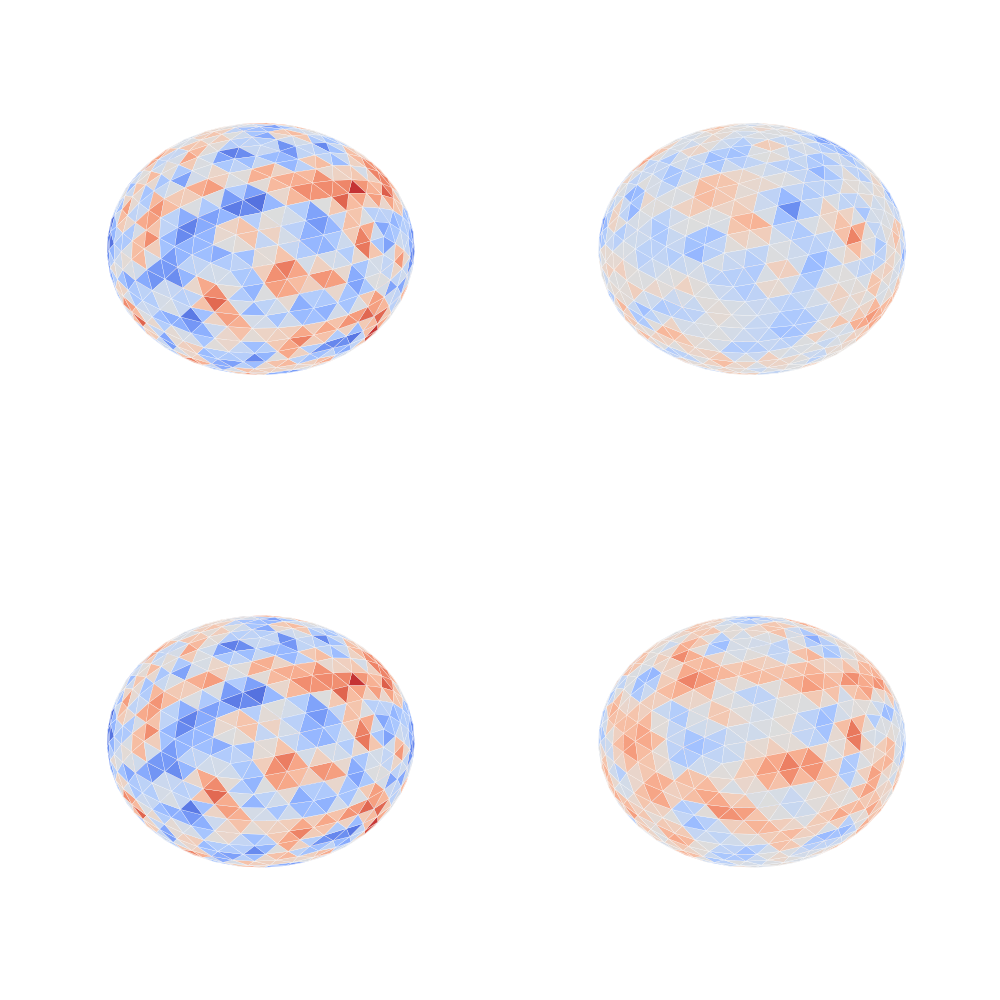
GroupMixUp
texture = np.random.uniform(0, 3, len(vertices))
group_textures = np.random.uniform(0, 3, (10, len(vertices)))
aug = GroupMixUp(prob=interval((0.2, 0.5), float), n_vertices=len(vertices))
display(vertices, triangles, texture, aug, group_data=group_textures,
        n_samples=1)
GroupMixUp group
textures = np.random.uniform(0, 3, (100, len(vertices)))
neigh_ind = GroupMixUp.groupby(textures, n_neighbors=4, n_components=30)
print(neigh_ind)
[[ 1 58 10 74 49]
 [ 2 62 47 15 99]
 [ 3 92 54 65 74]
 [ 4 60 30 64 31]
 [ 5 14  8 10 31]
 [ 6 60 78 90 76]
 [ 7 49 14 93 10]
 [ 8 21 70  5 80]
 [ 9 15 22 14 46]
 [10 89 25 82 73]
 [11 47 93 59 56]
 [12 82 19 99 80]
 [13 15 23 28 47]
 [14  5 51 47 79]
 [15  9 13 58 23]
 [16 82 10 59 23]
 [17 70 77 78 15]
 [18 88 10 56 78]
 [19 82 12 60 80]
 [20 52 46 95 15]
 [21 48 64 73 15]
 [22 72  9 15 66]
 [23 13 15 52 16]
 [24 30 73 64 15]
 [25 10 69 28 86]
 [26 46 58 49 30]
 [27 66 86 70 22]
 [28 13 49 25 15]
 [29 58 59 95 83]
 [30 24 78 63 36]
 [31 69 58 65 54]
 [32 63 10 82 58]
 [33 60 49 59  6]
 [34 15 93 69 39]
 [35 82 42 74 62]
 [36 30 86 93 78]
 [37 86 82 29 72]
 [38 70  8 82 73]
 [39 62 45 71 29]
 [40 82 90 58 59]
 [41  2 65 36 37]
 [42 81 31 69 82]
 [43 90 15 58 47]
 [44 58 60 26 21]
 [45 39 78 90 87]
 [46 86 95 60  9]
 [47 14 15 13 81]
 [48 21 78 82 98]
 [49 97 80 28 14]
 [50 29  0 82 95]
 [51 14 99 37 70]
 [52 81 54 23 80]
 [53 23 49 72 68]
 [54 52 31 46  3]
 [55 74 72 23 24]
 [56 18 86 11 88]
 [57 73  9 14 29]
 [58 64 15  1 29]
 [59 80 10 82 29]
 [60 80  6 96 46]
 [61 83 62 23 17]
 [62 83 94  2 39]
 [63 47 10 30 32]
 [64 73 58 81 24]
 [65 31 68 60 64]
 [66 59 82 27 10]
 [67 74 36 33 93]
 [68 14 65 60 82]
 [69 25 90 31 86]
 [70 90 17  8 38]
 [71 39 78 88 31]
 [72 22 37  9 86]
 [73 64 24 57 10]
 [74  1 93 10 55]
 [75  9 15 14 82]
 [76 95 82  6 18]
 [77 17 74 95 92]
 [78 30 80  6 18]
 [79 14 77 39 60]
 [80 59 60 49  0]
 [81 52 42 64 92]
 [82 16 10 95 59]
 [83 61 62 29 82]
 [84 10 82 83 54]
 [85 31 71 39 54]
 [86 37 46 82 60]
 [87 99 62 80 52]
 [88 18 94 46 90]
 [89 10 96 82 62]
 [90 70 43 69 45]
 [91 88 10 99 37]
 [92 81 82 95 14]
 [93 74 36 14 34]
 [94 62 88 46 58]
 [95 82 46 92 29]
 [96 60 64 89 59]
 [97 49 73 81 14]
 [98 82 48 80 22]
 [99 87 51 80 37]]
Transformer
texture = np.random.uniform(0, 3, len(vertices))
aug1 = SurfCutOut(vertices=vertices, triangles=triangles, neighs=neighs,
                  patch_size=interval((1, max_depth), int),
                  n_patches=interval((1, 3), int))
aug2 = SurfNoise(sigma=interval((1, 3), float))
aug3 = SurfBlur(vertices=vertices, triangles=triangles,
                sigma=interval((0.1, 1), float))
trans = Transformer()
trans.register(aug1, probability=.75)
trans.register(aug2, probability=.75)
trans.register(aug3, probability=.5)
display(vertices, triangles, texture, trans)

plt.show()
Total running time of the script: (0 minutes 11.110 seconds)
Estimated memory usage: 96 MB
Follow us