
Deep learning for NeuroImaging in Python.
Note
Go to the end to download the full example code.
Spherical neighbors
Credit: A Grigis
A simple example on how to build spherical neighbors using an icosahedron.
import matplotlib.pyplot as plt
from surfify.utils import icosahedron, neighbors, get_rectangular_projection
from surfify.plotting import plot_trisurf
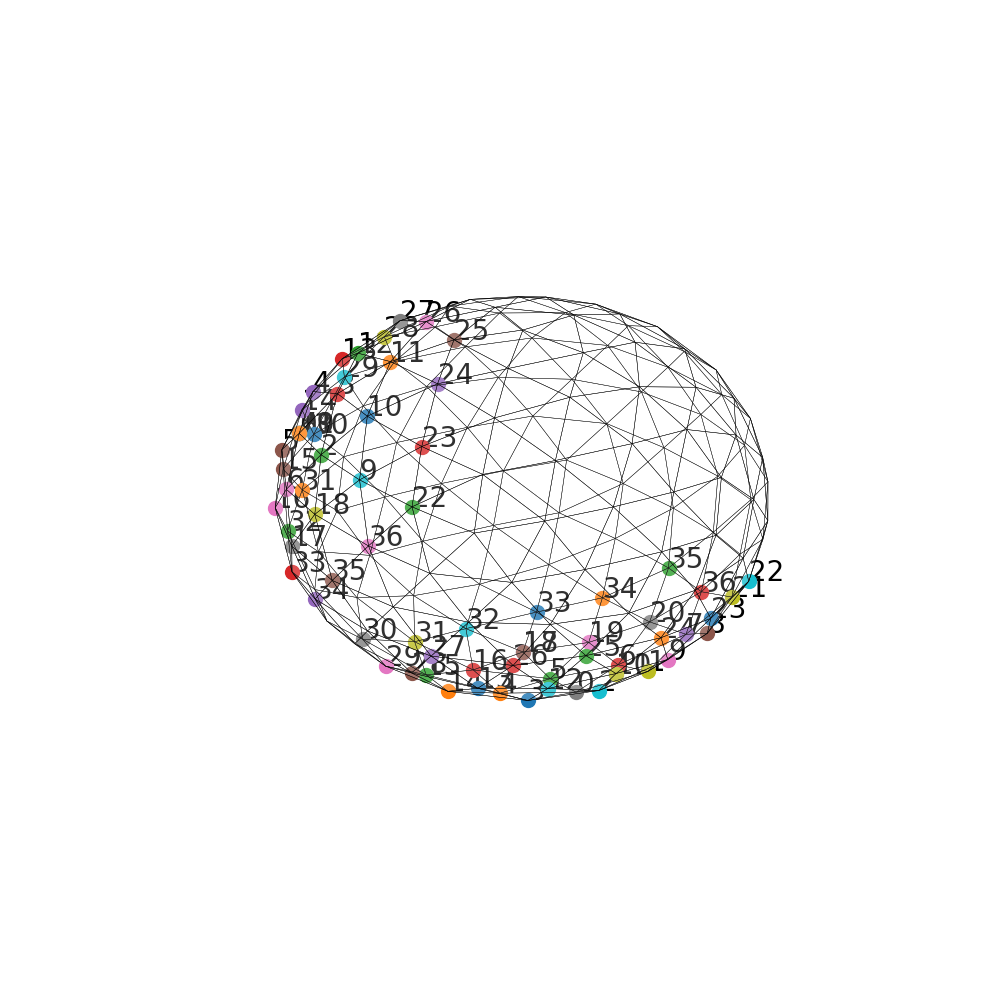
Direct Neighbor
Display direct neighbors for some vertices.
vertices, triangles = icosahedron(order=2)
neighs = neighbors(vertices, triangles, depth=3, direct_neighbor=True)

fig, ax = plt.subplots(1, 1, subplot_kw={
    "projection": "3d", "aspect": "auto"}, figsize=(10, 10))
plot_trisurf(vertices, triangles=triangles, colorbar=False, fig=fig, ax=ax,
             linewidths=0.3)
for vidx in (4, 40):
    for cnt, idx in enumerate(neighs[vidx]):
        point = vertices[idx]
        ax.scatter(point[0], point[1], point[2], marker="o", s=100)
        ax.text(point[0], point[1], point[2], str(cnt), size=20)
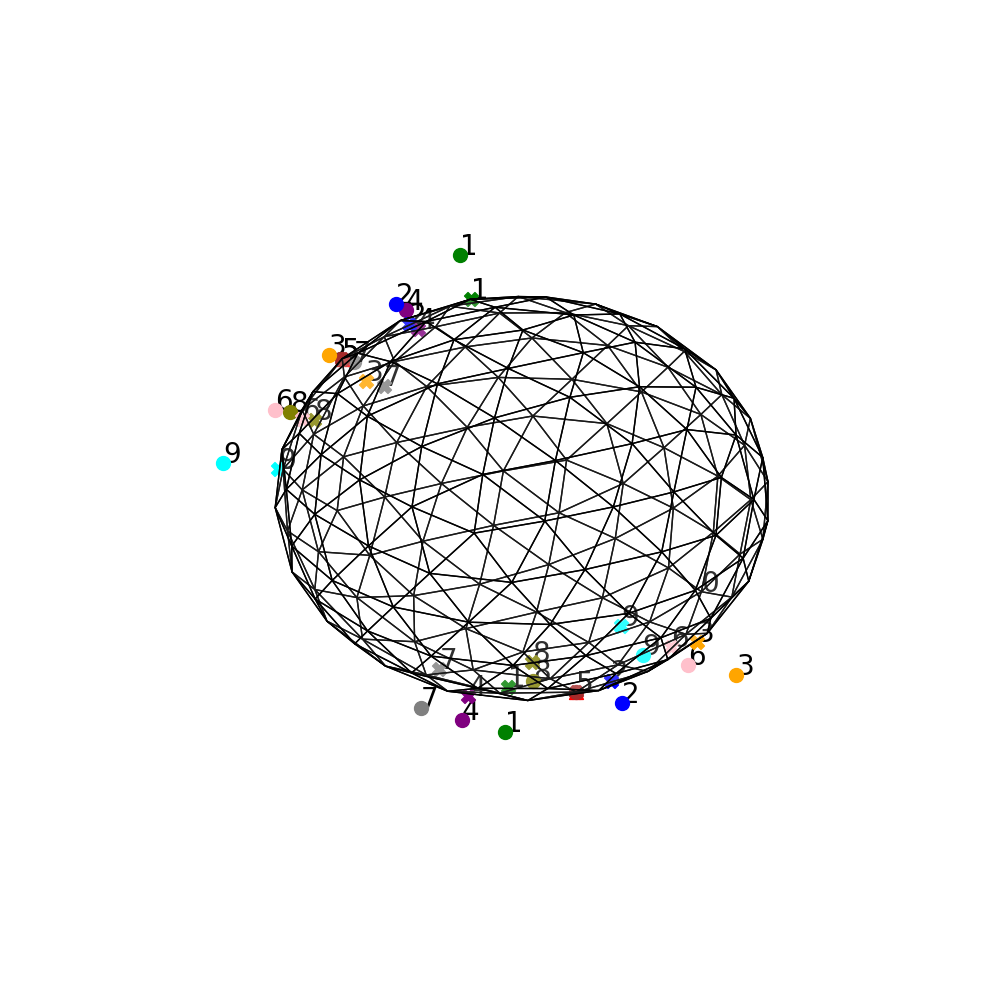
Rectagular Tangent Plane Neighbor
Display 3x3 rectangular tangent plane neighbors for some vertices and the associated projection on the sphere.
zoom = 2
colors = ["red", "green", "blue", "orange", "purple", "brown", "pink",
          "gray", "olive", "cyan", "yellow", "tan", "salmon", "violet",
          "steelblue", "lime", "navy"] * 5
fig, ax = plt.subplots(1, 1, subplot_kw={
        "projection": "3d", "aspect": "auto"}, figsize=(10, 10))
plot_trisurf(vertices, triangles=triangles, fig=fig, ax=ax)
for idx in (13, 40):
    node = vertices[idx]
    node_rec_neighs, node_tplane_neighs = get_rectangular_projection(
        node, size=3, zoom=zoom)
    ax.scatter(node[0], node[1], node[2], marker="^", c=colors[0], s=100)
    ax.text(point[0], point[1], point[2], 0, size=20)
    for cnt, point in enumerate(node_tplane_neighs):
        ax.scatter(point[0], point[1], point[2], marker="o", c=colors[cnt + 1],
                   s=100)
        ax.text(point[0], point[1], point[2], str(cnt + 1), size=20)
    for cnt, point in enumerate(node_rec_neighs):
        ax.scatter(point[0], point[1], point[2], marker="X", c=colors[cnt + 1],
                   s=100)
        ax.text(point[0], point[1], point[2], str(cnt + 1), size=20)

plt.show()
Total running time of the script: (0 minutes 2.304 seconds)
Estimated memory usage: 195 MB
Follow us